Per capita GDP (current, USD) between 1960 and 2014 for 10 ASEAN member states were fetched from World Bank's World Development Indicators (http://data.worldbank.org/data-catalog/world-development-indicators) using the following R script (What is R?).
library(WDI)
asean <- c("BN","KH","ID","LA","MY","MM","PH","SG","TH","VN")
gdp <- WDI(country = asean, indicator = "NY.GDP.PCAP.CD", start = 1960, end = 2014, extra = FALSE, cache = NULL)
gdp$unit <- "USD"
gdp$source <- "WDI"
colnames(gdp) <- sub("NY.GDP.PCAP.CD","GDP",colnames(gap))
data frame 'gdp' were used to crate and save below figures as tif image with each of corresponding R scripts.

tiff(file="highincomeasean.tif",width=6,height=8, unit="in", res=300)
plot(gdp$year[gdp$iso2c=="SG"],gdp$GDP[gdp$iso2c=="SG"],type="l",lwd=4,col="red",ylab="Per Capita GDP (Current, USD)",xlab="Year",main="High Income ASEAN")
lines(gdp$year[gdp$iso2c=="BN"],gdp$GDP[gdp$iso2c=="BN"],col="green",lwd=2)
lines(gdp$year[gdp$iso2c=="MY"],gdp$GDP[gdp$iso2c=="MY"],col="blue",lwd=1)
legend(1960,55000, c("SG","BN","MY"),lty=c(1,1,1), lwd=c(4,2,1),col=c("red","green","blue"))
dev.off()

tiff(file="middleincomeasean.tif",width=6,height=8, unit="in", res=300)
plot(gdp$year[gdp$iso2c=="TH"],gdp$GDP[gdp$iso2c=="TH"],type="l",lwd=4,col="red",ylab="Per Capita GDP (Current, USD)",xlab="Year",main="Middle Income ASEAN")
lines(gdp$year[gdp$iso2c=="ID"],gdp$GDP[gdp$iso2c=="ID"],col="green",lwd=3)
lines(gdp$year[gdp$iso2c=="PH"],gdp$GDP[gdp$iso2c=="PH"],col="blue",lwd=2)
lines(gdp$year[gdp$iso2c=="VN"],gdp$GDP[gdp$iso2c=="VN"],col="black",lwd=1)
legend(1960,5500, c("TH","ID","PH","VN"),lty=c(1,1,1,1), lwd=c(4,3,2,1),col=c("red","green","blue","black"))
dev.off()
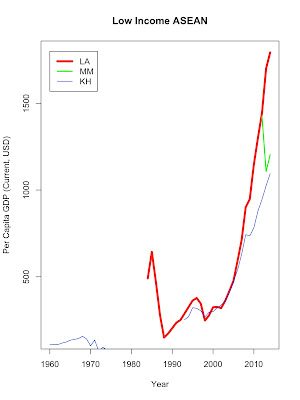
tiff(file="lowincomeasean.tif",width=6,height=8, unit="in",res=300)
plot(gdp$year[gdp$iso2c=="LA"],gdp$GDP[gdp$iso2c=="LA"],type="l",lwd=4,col="red",ylab="Per Capita GDP (Current, USD)",xlab="Year",main="Low Income ASEAN")
lines(gdp$year[gdp$iso2c=="MM"],gdp$GDP[gdp$iso2c=="MM"],col="green",lwd=2)
lines(gdp$year[gdp$iso2c=="KH"],gdp$GDP[gdp$iso2c=="KH"],col="blue",lwd=1)
legend(1960,1800, c("LA","MM","KH"),lty=c(1,1,1), lwd=c(4,2,1),col=c("red","green","blue"))
dev.off()
No comments:
Post a Comment