Thursday, December 31, 2015

Extract Rice Export Data of Cambodia from UN's COMTRADE

(1) Run following function (comtrade api for R) once. COMTRADE data can be manually, but with limited flexibility at http://comtrade.un.org/data/


get.Comtrade <- function(url="http://comtrade.un.org/api/get?"
                          ,maxrec=50000
                          ,type="C"
                          ,freq="A"
                          ,px="HS"
                          ,ps="now"
                          ,r
                          ,p
                          ,rg="all"
                          ,cc="TOTAL"
                          ,fmt="json"
 )
 {
   string<- paste(url
                  ,"max=",maxrec,"&" #maximum no. of records returned
                  ,"type=",type,"&" #type of trade (c=commodities)
                  ,"freq=",freq,"&" #frequency
                  ,"px=",px,"&" #classification
                  ,"ps=",ps,"&" #time period
                  ,"r=",r,"&" #reporting area
                  ,"p=",p,"&" #partner country
                  ,"rg=",rg,"&" #trade flow
                  ,"cc=",cc,"&" #classification code
                  ,"fmt=",fmt        #Format
                  ,sep = ""
   )
   
   if(fmt == "csv") {
     raw.data<- read.csv(string,header=TRUE)
     return(list(validation=NULL, data=raw.data))
   } else {
     if(fmt == "json" ) {
       raw.data<- fromJSON(file=string)
       data<- raw.data$dataset
       validation<- unlist(raw.data$validation, recursive=TRUE)
       ndata<- NULL
       if(length(data)> 0) {
         var.names<- names(data[[1]])
         data<- as.data.frame(t( sapply(data,rbind)))
         ndata<- NULL
         for(i in 1:ncol(data)){
           data[sapply(data[,i],is.null),i]<- NA
           ndata<- cbind(ndata, unlist(data[,i]))
         }
         ndata<- as.data.frame(ndata)
         colnames(ndata)<- var.names
       }
       return(list(validation=validation,data =ndata))
     }
   }

}


(2) Run following function to download annual rice export value of Cambodia (aggregated from all other reporters) between 1990 and 2014 (116 is country code for Cambodia, and 1006 is commodity code of rice)


dat <- 1990:2014
dat <- as.data.frame(dat,ncol=1)
colnames(dat) <- "year"
dat$rice_x <- NA
for(i in 1990:2014){
tmp <- NA
tmp <- get.Comtrade(r="all", p="116",ps=i, px="H0", cc="1006", rg=1,fmt="csv")
dat$rice_x[dat$year==i] <- sum(tmp$data$Trade.Value..US..,na.rm=TRUE)
print(dat[dat$year==i,])
Sys.sleep(1)
}


(3) Run following code to save below graph in tif format


tiff(file="cambodia_rice_export.tif",width=6,height=6, unit="in",res=300)
plot(dat$year,dat$rice_x/1000000,ylab="Million USD",xlab="Year",type="o",col="blue")

dev.off()


Create Elevation Map of Cambodia

(1) download elevation raster (choose country mask) from http://www.diva-gis.org/gdata

(2) expand it to the same directory as your R script (What is R?)

(3) Run this script to create image file ("cambodia_elevation.tif")

library(raster)

r <-raster("KHM_msk_alt/KHM_msk_alt.grd")
tiff(file="cambodia_elevation.tif",width=6,height=6, unit="in",res=300)
plot(r)
dev.off()


Wednesday, December 30, 2015

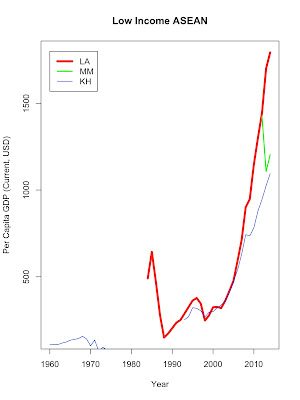
Per Capita GDP in ASEAN (Based on WDI)


Per capita GDP (current, USD) between 1960 and 2014 for 10 ASEAN member states were fetched from World Bank's World Development Indicators (http://data.worldbank.org/data-catalog/world-development-indicators) using the following R script (What is R?).


library(WDI)

asean <- c("BN","KH","ID","LA","MY","MM","PH","SG","TH","VN")

gdp <- WDI(country = asean, indicator = "NY.GDP.PCAP.CD", start = 1960, end = 2014, extra = FALSE, cache = NULL)
gdp$unit <- "USD"
gdp$source <- "WDI"
colnames(gdp) <- sub("NY.GDP.PCAP.CD","GDP",colnames(gap))


data frame 'gdp' were used to crate and save below figures as tif image with each of corresponding R scripts.


tiff(file="highincomeasean.tif",width=6,height=8unit="in", res=300)
plot(gdp$year[gdp$iso2c=="SG"],gdp$GDP[gdp$iso2c=="SG"],type="l",lwd=4,col="red",ylab="Per Capita GDP (Current, USD)",xlab="Year",main="High Income ASEAN")
lines(gdp$year[gdp$iso2c=="BN"],gdp$GDP[gdp$iso2c=="BN"],col="green",lwd=2)
lines(gdp$year[gdp$iso2c=="MY"],gdp$GDP[gdp$iso2c=="MY"],col="blue",lwd=1)
legend(1960,55000, c("SG","BN","MY"),lty=c(1,1,1), lwd=c(4,2,1),col=c("red","green","blue"))
dev.off()


tiff(file="middleincomeasean.tif",width=6,height=8unit="in"res=300)
plot(gdp$year[gdp$iso2c=="TH"],gdp$GDP[gdp$iso2c=="TH"],type="l",lwd=4,col="red",ylab="Per Capita GDP (Current, USD)",xlab="Year",main="Middle Income ASEAN")
lines(gdp$year[gdp$iso2c=="ID"],gdp$GDP[gdp$iso2c=="ID"],col="green",lwd=3)
lines(gdp$year[gdp$iso2c=="PH"],gdp$GDP[gdp$iso2c=="PH"],col="blue",lwd=2)
lines(gdp$year[gdp$iso2c=="VN"],gdp$GDP[gdp$iso2c=="VN"],col="black",lwd=1)
legend(1960,5500, c("TH","ID","PH","VN"),lty=c(1,1,1,1), lwd=c(4,3,2,1),col=c("red","green","blue","black"))
dev.off()


tiff(file="lowincomeasean.tif",width=6,height=8, unit="in",res=300)
plot(gdp$year[gdp$iso2c=="LA"],gdp$GDP[gdp$iso2c=="LA"],type="l",lwd=4,col="red",ylab="Per Capita GDP (Current, USD)",xlab="Year",main="Low Income ASEAN")
lines(gdp$year[gdp$iso2c=="MM"],gdp$GDP[gdp$iso2c=="MM"],col="green",lwd=2)
lines(gdp$year[gdp$iso2c=="KH"],gdp$GDP[gdp$iso2c=="KH"],col="blue",lwd=1)
legend(1960,1800, c("LA","MM","KH"),lty=c(1,1,1), lwd=c(4,2,1),col=c("red","green","blue"))
dev.off()